
MAPL-EMIT: how deep learning sharpens satellite methane detection
MAPL-EMIT is a vision transformer that reads every usable band of NASA's EMIT imaging spectrometer and returns methane enhancements, plume outlines and source locations in a single pass. This digest explains how it was trained, what its authors report and where satellite methane detection still needs human review.
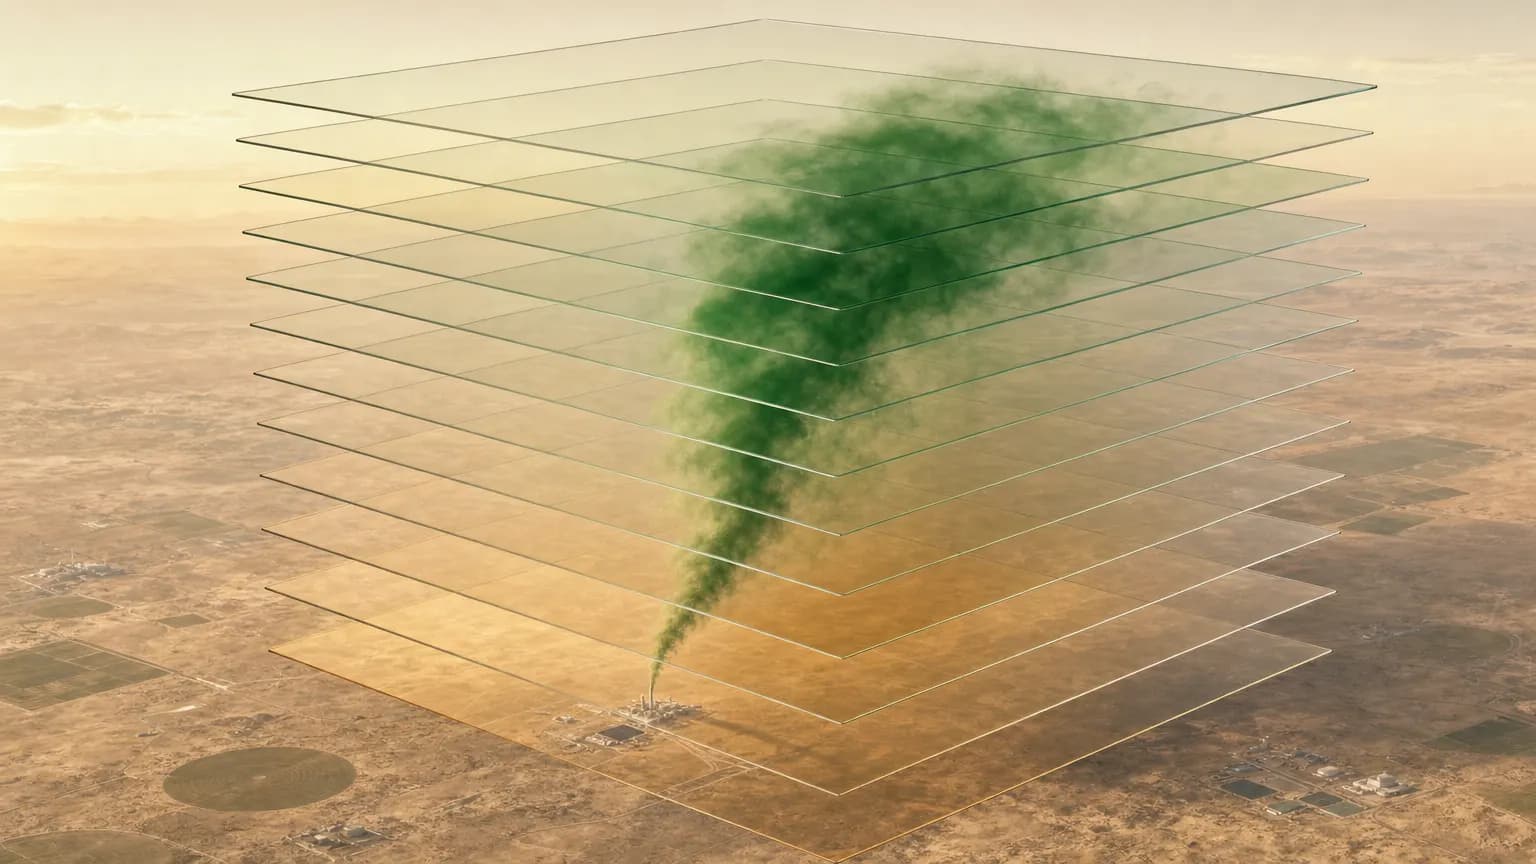
What is MAPL-EMIT?
MAPL-EMIT, short for Methane Analysis and Plume Localization with EMIT, is a deep learning framework for satellite methane detection at the scale of individual facilities. Researchers from Google Research, NASA's Jet Propulsion Laboratory and the Carnegie Institution for Science describe it in a paper published in the Proceedings of the National Academy of Sciences on 1 September 2026, with a preprint on arXiv.
The model reads calibrated radiance from EMIT, an imaging spectrometer on the International Space Station, and answers three questions at once: how much extra methane sits in each pixel, where each plume's boundary lies and where the gas most likely came from. Most existing pipelines compute enhancements with a matched filter first, then separate plumes by hand or with a second model.
The paper's introduction explains why this matters. Methane's 20-year global warming potential is 81 to 86 times that of carbon dioxide, and the gas accounts for roughly 25% of human-induced warming since industrialisation. Because its atmospheric lifetime is only about nine years, cuts take effect quickly; over 125 countries have joined the Global Methane Pledge to reduce emissions 30% by 2030.
Why is satellite methane detection so difficult?
Satellite methane detection is hard because no current instrument combines wide coverage, small pixels and fine spectral sampling. Methane is invisible to the eye, so sensors find it through narrow absorption features in short-wave infrared light, and a facility leak covers only a few pixels against bright, varied ground that can imitate the same signal.
The paper sets out the trade-off. TROPOMI sees the whole planet daily but at about 5.5 by 3.5 km per pixel, too coarse to isolate one site. Commercial imagers such as GHGSat reach 25 m but cover little ground and restrict data access. Multispectral missions such as Sentinel-2 and Landsat sit in between, yet their broad bands reveal only very large releases.
EMIT, designed to map minerals in arid regions, turned out to be a useful compromise: it records 285 bands between 381 and 2,493 nm at 60 m resolution across an 80 km swath. The usual way to read methane from such data is an adaptive matched filter plus expert review, and surface clutter, uneven terrain and retrieval artefacts create false alarms that are slow to clear at global scale.
How does MAPL-EMIT work?
MAPL-EMIT treats each 256 by 256 pixel EMIT tile as an image with hundreds of channels. A transformer encoder looks at the spectrum of every pixel and at the patterns around it, which lets the model tell a wind-shaped plume from a patch of ground that merely shares a similar spectral signature.
According to the paper, the network follows a U-Net layout: a Swin-v2-S transformer encoder of about 30 million parameters compresses the input, and a convolutional decoder restores full resolution through skip connections. Besides EMIT L1B radiances, the model receives solar and satellite zenith angles and each pixel's cross-track position, and the radiances are normalised to reduce detector striping.
The decoder feeds three groups of output heads. Each group has 10 slots, one per possible plume in a tile, and during training the Hungarian matching algorithm pairs predicted slots with true plumes, so the order of the outputs does not matter.
For a full EMIT granule of roughly 5,700 km², the tile window slides in 64-pixel steps, so each location is seen in up to 16 overlapping passes. The outputs are blended into one enhancement map, duplicates are merged, and every remaining plume goes through a physics-based spectral check.
- Enhancement quantification. Each slot predicts, pixel by pixel, the extra methane column for its plume. The loss works on square-rooted values so that faint plumes are not drowned out by strong ones.
- Plume delineation. A matching mask head draws the footprint of each plume, which keeps neighbouring plumes apart even when their downwind tails merge.
- Source localisation. An origin head marks a small disc around the likely emission point, and the probability-weighted centre of that disc gives the estimated source coordinates.
Training on 3.6 million simulated plumes
Because no labelled collection of millions of real plumes exists, the team generated its own. It simulated 3.6 million methane plumes with a Lagrangian puff model and injected them into real EMIT radiance, so the model learned from genuine backgrounds with exactly known plumes on top.
Each simulated source releases gas intermittently, and simplex noise drives a stochastic wind field that adds eddies and turbulence. The simulations are two-dimensional, since a satellite measures only the column total, and run on a grid of 60 m cells. Up to 10 plumes are injected per training tile, clustered so that some tails overlap, and scaled to emission rates between 100 and 10,000 kg/h.
To turn a gas column into what EMIT would record, the authors computed methane transmittance line by line from the HITRAN database, stored it in a look-up table and applied the Beer-Lambert law. Scattering, water vapour and aerosols were left out for speed; a sensitivity check found no clear link between retrieval error and water vapour or aerosol levels.
Backgrounds came from about 235 thousand EMIT tiles, one random date per location, split 70%, 15% and 15% into training, validation and test sets. One in ten training samples held no plume, so the model would not expect one everywhere. Training took about 96 hours on 32 Google TPU chips.
How accurate is MAPL-EMIT on simulated plumes?
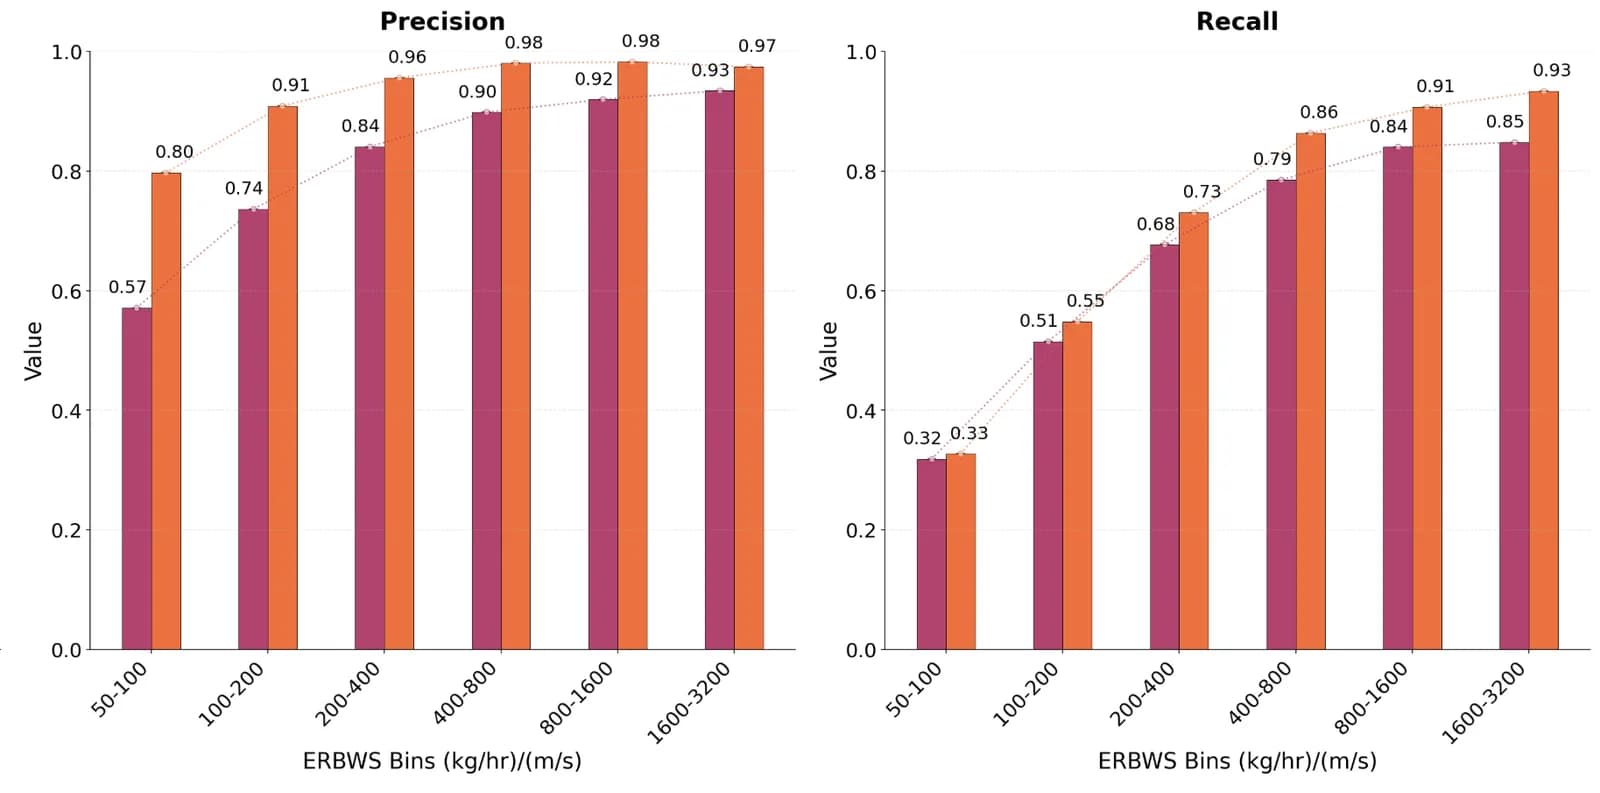
On a held-out synthetic test set, the authors report that precision for single plumes climbs from 0.80 for the faintest class to 0.97 for the strongest, while recall rises from 0.33 to 0.93. Faint here means 50 to 100 kg/h per m/s of wind, roughly 125 to 250 kg/h at a typical 2.5 m/s.
Pixel-level enhancement error, measured as normalised RMSE, ranges from 6% for the most enhanced pixels above 2500 ppm-m to 26% for pixels between 250 and 500 ppm-m, and grows for fainter ones. Summed over whole plumes, the errors partly cancel, leaving 8% for the strongest class and 24% for the weakest. Predicted sources land on average 101 m (1.68 pixels) from the true origin.
Overlapping plumes cost little: detection and quantification dip only modestly outside the faintest class, and the mean source error stays at 103 m. At the authors' main operating range of 100 to 200 kg/h per m/s, about 250 to 500 kg/h at 2.5 m/s, precision, recall and F1 all exceed 50%. They call this an improvement of roughly 2 to 4 times over earlier models, which reach a 10% detection probability near 1000 kg/h.
Results against NASA's expert-annotated plumes
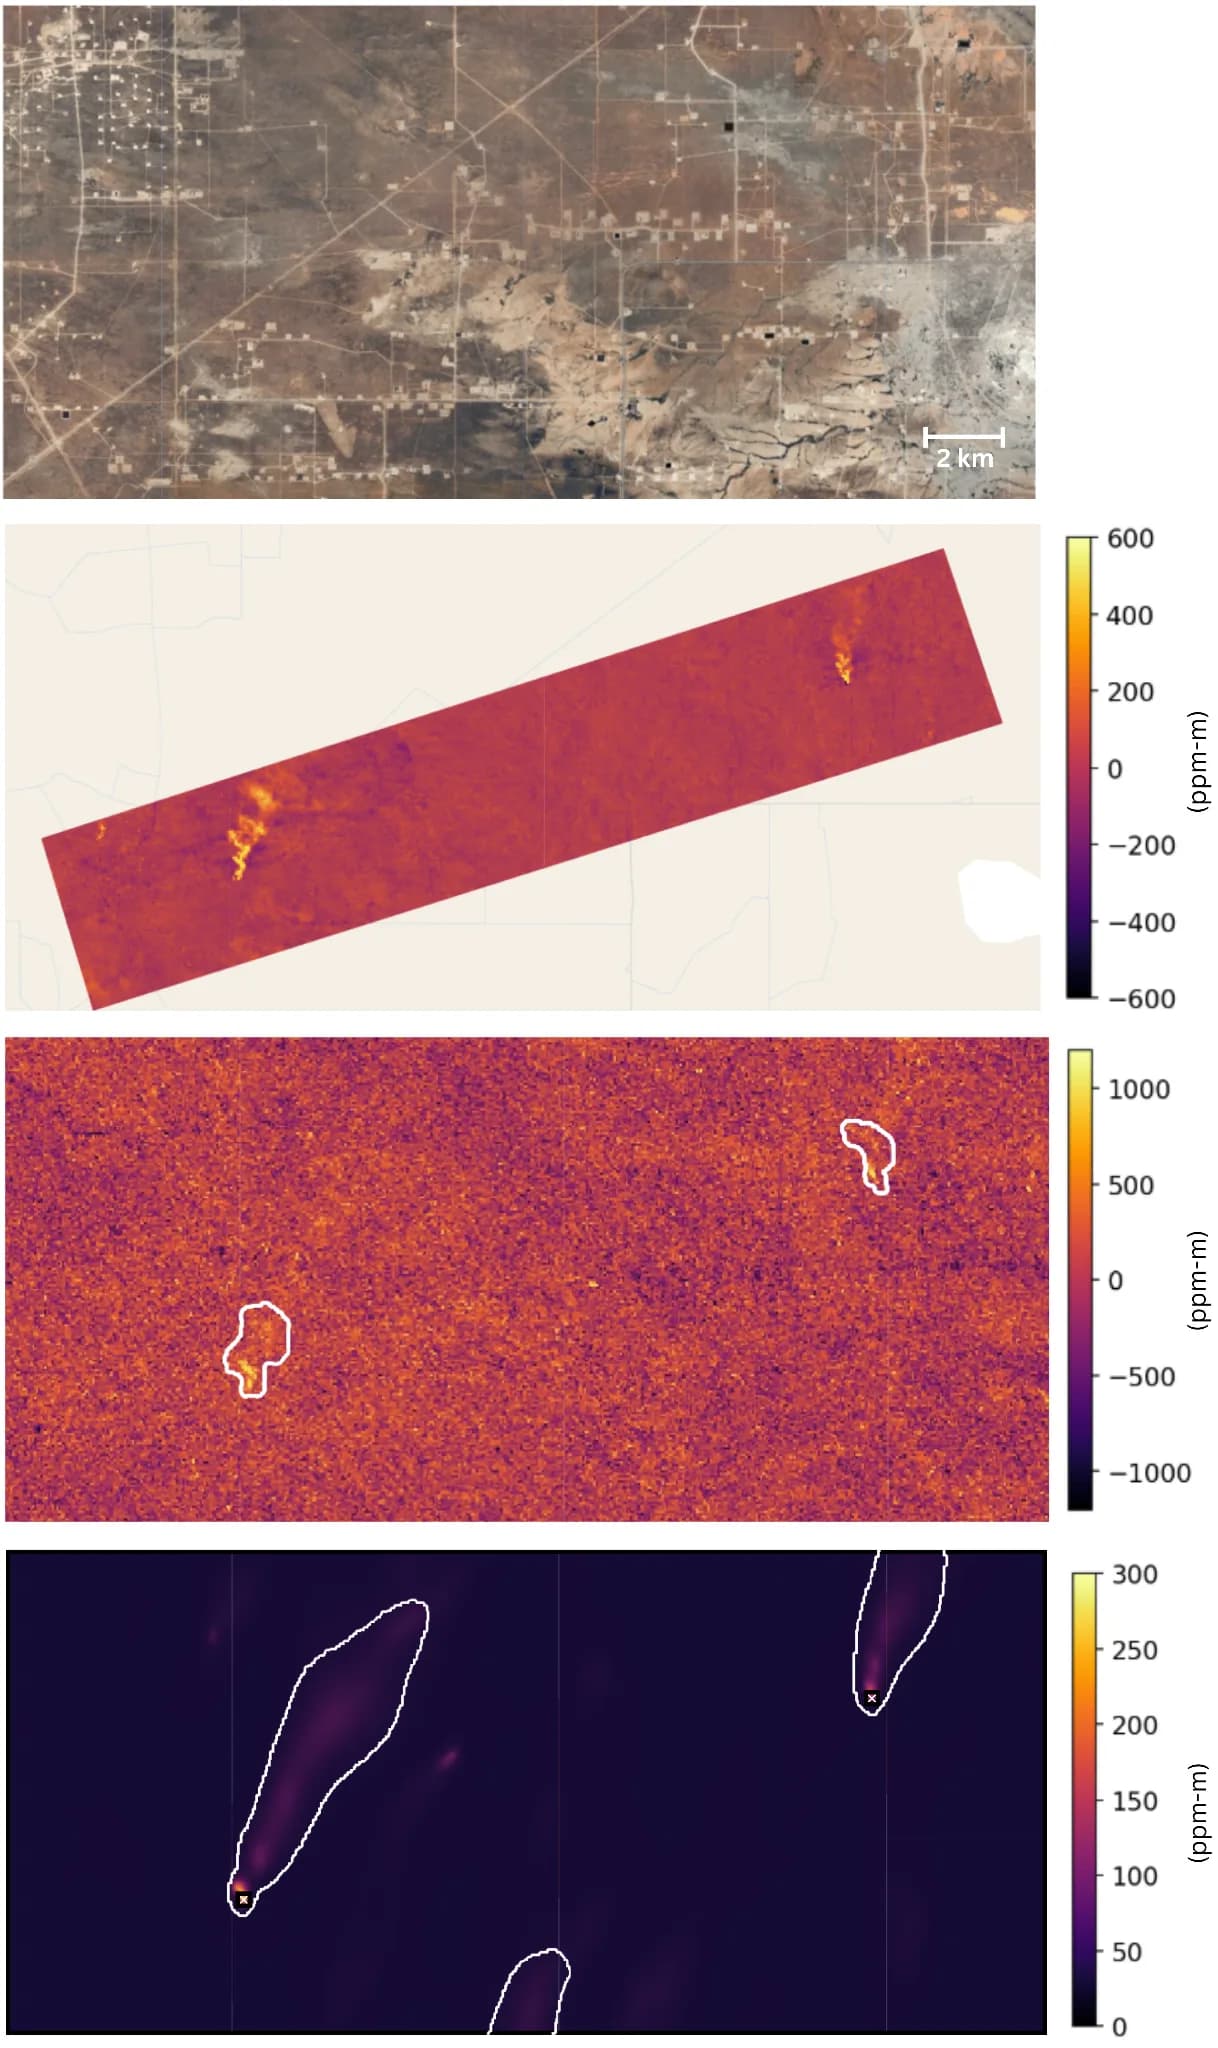
Measured against NASA's expert-reviewed EMIT L2B methane plume complexes, MAPL-EMIT recovers 84% of the listed plumes, the authors report. The test covered 1084 EMIT granules containing 1689 catalogued plumes, and a plume counted as found when the outlines intersected.
The model also finds far more candidates. After keeping only plumes over land that appeared in more than 13 of 16 overlapping passes, 2210 of its 3672 initial detections remained, and only 67% of those match a catalogue entry. The authors trace the gap to faint plumes a matched filter cannot separate from noise, strong plumes the catalogue omitted under strict review rules, and some false positives.
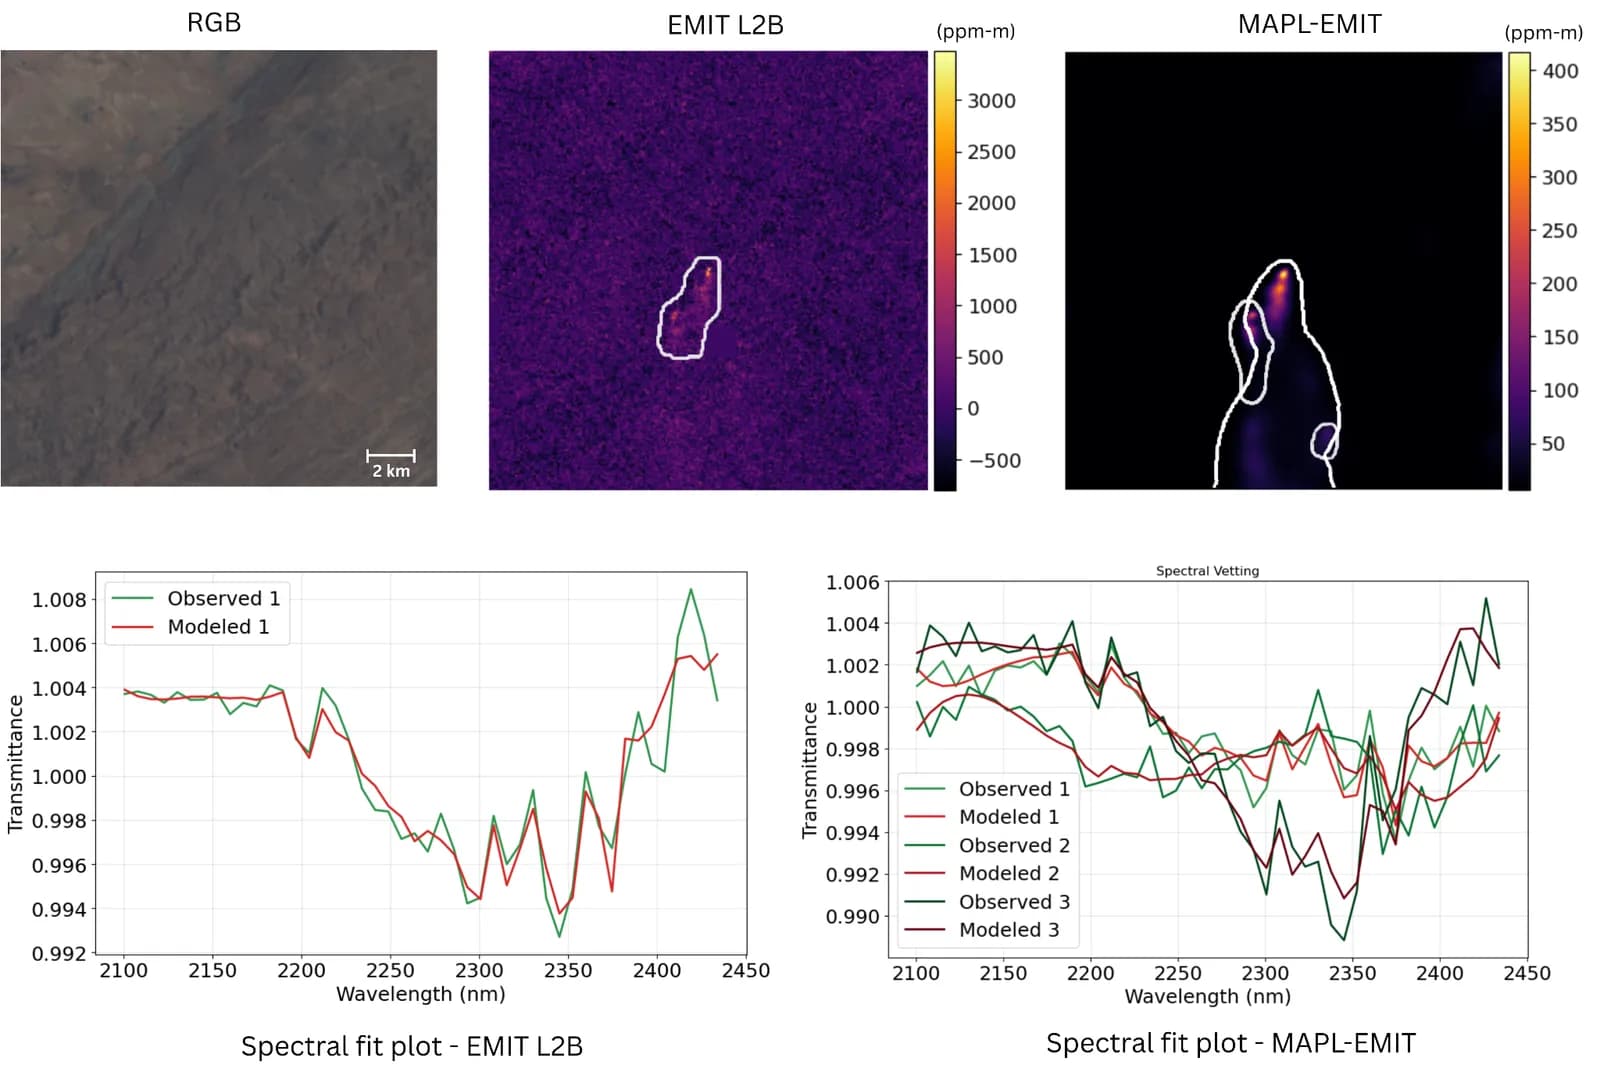
Agreement with physics improved too. Comparing enhancements with an independent spectral fit, the authors measure a symmetric mean absolute percentage error of 56% for MAPL-EMIT and 117% for the L2B product on the same granules, which suggests the model's maps contain fewer noisy extremes.
Independent checks: landfills, aircraft and controlled releases
Four further tests probe false alarms and faint plumes, and they point the same way: the model finds real emissions that standard products miss, while its rate of unconfirmed detections stays measurable and filterable.
- Near-empty granules. Across 20,000 granules where NASA JPL expects few plumes, the model made 1513 filtered detections, and spectral fits supported 355. The authors treat the other 1158, about 0.07 per granule, as a conservative upper bound on false positives, mostly over hilly terrain or dense forest.
- Top-emitting landfills. At the world's 25 highest-emitting landfills, MAPL-EMIT, given no wind or site information, flagged potential plumes at 24, against 17 reported earlier for the L2B product. It also tracked a persistent source in Amman, Jordan, across repeated overpasses.
- Airborne comparison. Against AVIRIS-3 flights within 30 minutes of an EMIT overpass, three airborne plumes stayed visible at 60 m. MAPL-EMIT found two, with no false positives and a signal-to-noise ratio of 8.60, against 1.21 for the resampled airborne data and 0.40 for L2B.
- Controlled releases. In Stanford's controlled release experiments in Arizona, the model detected five of seven releases seen by EMIT; a sixth showed in the enhancement map but fell below the plume threshold.
What are the limitations of MAPL-EMIT?
False positives are the main limitation the authors acknowledge. Like other machine learning detectors, MAPL-EMIT flags many more unverified plumes than expert-vetted catalogues, and without complete ground truth the true error rate cannot be pinned down, so some review of model-identified plumes may still be required.
Our analysis: the strongest evidence is agreement across several imperfect references, not any single score. When comparing detectors, check which reference set, filters and plume definition each number relies on.
- Incomplete coverage. The model misses about 16% of the L2B plume complexes, so its own catalogue is not complete either.
- Confidence tiers. High-confidence plumes recur in three or more separate EMIT observations. Medium-confidence plumes have no repeat match, so the catalogue advises extra filtering, for example against known infrastructure or local wind direction, before using them.
- Hard scenes. Synthetic tests show most failures where plumes crowd together, where emissions are intermittent or fragmented, and over dark surfaces such as water.
- Indirect realism check. The synthetic plumes could not be compared directly with many real ones; their realism is inferred from the model's performance on real data.
- Simplified physics and sensor drift. Radiative transfer ignores scattering, water vapour and aerosols, and accuracy on future data depends on sensor calibration, although retraining is simple because labels come from simulation.
- Emission rates. The model outputs enhancements, not leak rates, so converting to kg/h still needs wind data. End-to-end rate estimation is planned future work.
Why it matters for applied and enterprise AI
Our analysis: MAPL-EMIT shows a pattern that travels well beyond climate science. When real labels are scarce but the physics is well understood, simulation can supply training data at scale, provided the resulting model is then tested against real references.
Three design choices carry over to other sensing and inspection problems. Solving related outputs in one model, here quantity, shape and origin, avoids passing errors between stages. Attaching an independent check to each prediction, such as the spectral fit, gives operators a reason to accept or reject it. Publishing scores instead of one fixed threshold lets each user set their own balance between missed events and false alarms.
Can you access the MAPL-EMIT data, model and code?
Yes. The authors have published the plume database and enhancement maps on Google Earth Engine, together with a browsing app. Kaggle hosts the trained model and the 3.6 million synthetic plumes, and GitHub hosts the inference code.
The current Earth Engine catalogue entry, which supersedes an earlier listing of the same collection, covers plume records from 10 August 2022 to 9 June 2026 under CC BY 4.0, with the required attribution “This dataset is produced by Google”. Each plume carries enhancement, plume and origin probabilities, spectral fit distances, a detection count, ERA5 wind components and a high or medium confidence tag.
The GitHub library, under the Apache 2.0 licence, runs tiled inference, merges duplicates and vets plumes spectrally on EMIT L1B radiance and observation files from NASA Earthdata. Its Parquet outputs include plume outlines, source points, fit metrics and an emission rate estimate based on ERA5 wind.
Questions and answers
What is MAPL-EMIT used for?
MAPL-EMIT finds and maps methane plumes in data from NASA's EMIT imaging spectrometer on the International Space Station. For each plume it estimates the extra methane per pixel, outlines the plume and locates its likely source. The authors ran it across the EMIT archive and released the results in Earth Engine.
How does deep learning improve satellite methane detection?
Standard methods score each pixel's spectrum on its own with a matched filter, then rely on experts to judge which patches are plumes. A vision transformer such as MAPL-EMIT also sees the shape and surroundings of the signal, so it can tell a wind-blown plume from ground that only looks similar. Its authors report lower detection limits and automatic separation of overlapping plumes.
Can MAPL-EMIT measure methane emission rates?
Not directly. The model estimates methane enhancement in ppm-m, plume outlines and source points, and turning those into a leak rate in kg/h requires wind data. The released inference library adds an emission rate estimate from ERA5 wind components, and the paper lists end-to-end rate estimation as future work.
Is the MAPL-EMIT plume database free to use?
The Earth Engine catalogue lists the plume collection under CC BY 4.0 and asks users to credit it as produced by Google. Access runs through Google Earth Engine, which the catalogue describes as free for research, education and nonprofit use; other users should check its terms. The model and synthetic plumes are on Kaggle, and the code is on GitHub under Apache 2.0.
Which satellites can MAPL-EMIT analyse?
The released model and code support EMIT only, because the model was trained on EMIT radiance and its particular set of bands. The authors plan to extend the simulation pipeline to other gases and satellites. Google's post adds that NASA's next imaging spectrometers should raise coverage by a factor of 30 to 50, which makes automation more important.
References
- Batchu, V. V., Conserva, M., Wilson, A., Michalak, A. M., Gulshan, V., Brodrick, P. G., Thorpe, A. K., & Arsdale, C. V. (2026). Global monitoring of methane point sources using deep learning on hyperspectral radiance measurements from EMIT. Proceedings of the National Academy of Sciences, 123(36), e2612145123. https://doi.org/10.1073/pnas.2612145123 (external site)
- Batchu, V. V., Conserva, M., Wilson, A., Michalak, A. M., Gulshan, V., Brodrick, P. G., Thorpe, A. K., & Arsdale, C. V. (2026). Global monitoring of methane point sources using deep learning on hyperspectral radiance measurements from EMIT [Preprint]. arXiv:2604.10094. https://arxiv.org/abs/2604.10094 (external site)
- Google Research. (2026). MAPL: Methane Analysis and Plume Localization [Computer software]. GitHub. https://github.com/google-research/mapl (external site)
- Google Research. (2026). MAPL-EMIT: Modeled methane plumes, version 1.0 [Data set]. Google Earth Engine Data Catalog. https://developers.google.com/earth-engine/datasets/catalog/projects_climate-and-sustainability_assets_ghg_emit_mapl_emit_plumes_v1_0 (external site)
- Batchu, V. (2026). MAPL-EMIT model for global methane plume detection [Model]. Kaggle. https://www.kaggle.com/models/vishalbatchu/emit-methane-plume-detection-and-quantification (external site)
- Batchu, V. (2026). Synthetic puff-based plumes [Data set]. Kaggle. https://www.kaggle.com/datasets/vishalbatchu/synthetic-puff-based-overlapping-plumes (external site)
- Thorpe, A., Brodrick, P., Chadwick, D., Lopez, A., Villanueva-Weeks, C., Fahlen, J., Jensen, D., Bender, H., Vinckier, Q., Xiang, C., Olson-Duvall, W., Chlus, A., Lundeen, S., Thompson, D., & Green, R. (2026). EMIT L2B estimated methane plume complexes 60 m V002 [Data set]. NASA Land Processes Distributed Active Archive Center. https://doi.org/10.5067/EMIT/EMITL2BCH4PLM.002 (external site)
Original article
Batchu, V., & Conserva, M. (2026, 1 September). Mapping global methane emissions from space with deep learning. Google Research Blog. https://research.google/blog/mapping-global-methane-emissions-from-space-with-deep-learning/ (external site)